
5.4 Graded Response Model#
The Graded Response Model (GRM; Samejima, 1969) is another widely used polytomous IRT model that, like the GPCM, includes item-specific discrimination parameters (\(\\alpha_i\)). However, the models differ in how they define response probabilities:
The GRM estimates the probability of responding in category \(h\) or higher (cumulative).
The GPCM estimates the probability of responding in category \(h\) exactly (nominal).
In the GRM, each threshold \(\beta_{ih}\) represents the boundary on the latent trait where the probability of responding in category \(h\) or higher is 0.5. As with the PCM and GPCM, items can have different numbers of categories.
The GRM can be estimated using the ltm package via the grm() function.
The Dataset#
To illustrate the GRM, we use the self-transcendence (ST) subscale from the ASTI dataset—previously used in the GPCM analysis. This subscale includes seven polytomous items appropriate for graded modeling.
Load data Fit the model#
# Imports
from rpy2 import robjects as ro
from rpy2.robjects import pandas2ri, numpy2ri
from rpy2.robjects.packages import importr
from jupyterquiz import display_quiz

# Miscellaneous
pandas2ri.activate()
numpy2ri.activate()
ro.r('set.seed(123)')
%load_ext rpy2.ipython

# R imports
importr('mirt')
importr('MPsychoR')
importr('eRm')
importr('ltm')
print("\n\n" + "Python & R packages imported successfully.")

# Load data
ro.r("data(ASTI)")
ASTI = pandas2ri.rpy2py(ro.globalenv['ASTI'])
STitems = ASTI.iloc[:, [1,3,7,12,15,23,24]]
ro.globalenv['STitems'] = STitems
The rpy2.ipython extension is already loaded. To reload it, use:
  %reload_ext rpy2.ipython


Python & R packages imported successfully.
# Fit the model
ro.r('fitgrm <- grm(STitems)')

# Estimate person parameter
ro.r('ppargrm <- ltm::factor.scores(fitgrm)')
OCCs and ICCs#
%%R
plot(fitgrm, type="OCCu", items = 1, main = "OCC GRM")
%%R
plot(fitgrm, type = "ICC", items = 1, main = "ICC GRM")
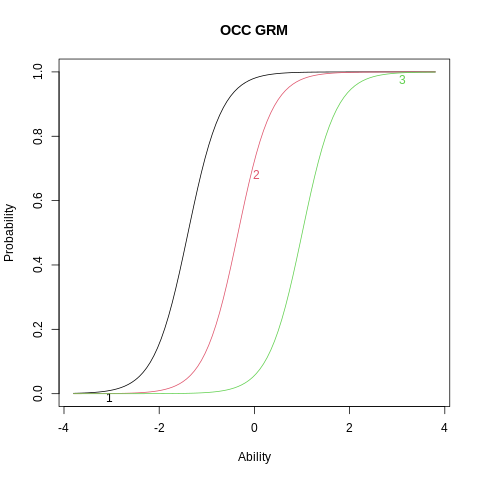
The upper panel displays the Operating Characteristic Curves (OCCs) for a selected item. Each curve represents the probability of scoring at or above a given category threshold:
The first curve shows the probability of scoring 1 or higher,
The second, 2 or higher,
The third, 3 or higher, and so on.
These curves are cumulative and naturally monotonically decreasing, reflecting the increasing difficulty of meeting higher category thresholds.
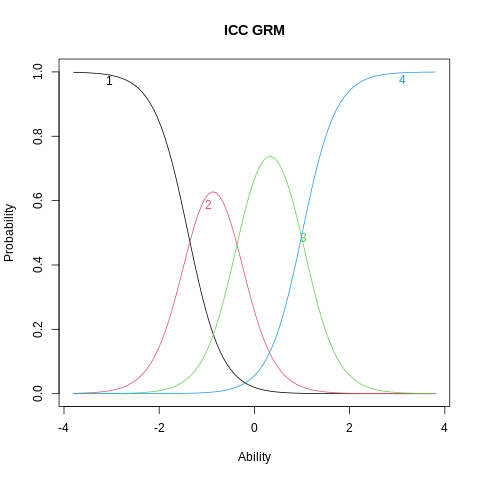
The lower panel shows the Item Category Characteristic Curves (ICCs), generated with:
plot(fitgrm, type = "ICC")
Each curve here reflects the probability of selecting a specific category—analogous to ICCs in the GPCM. Unlike OCCs, these curves are not cumulative and allow clearer comparisons between individual category probabilities across the trait continuum.
Test your understanding#
display_quiz("quiz/quiz_grm.json")